USING DATA TO DEVELOP SOLUTIONS FOR IMPROVING MASSACHUSSETT’S HOUSING CRISIS
Arrowstreet and ULI Boston are committed to addressing the housing challenges felt across the Commonwealth. According to a study conducted by McKinsey & Company, Massachusetts is one of the least affordable states and hosts some of the nation’s highest housing costs. Median home prices in greater Boston rose above $900,000 this year, representing an eleven-fold increase since 1980 compared to the national average of a six-fold increase per Boston Globe’s Spotlight research. Effectively combating these skyrocketing housing costs requires a multi-pronged approach, and one critical strategy is to increase the available supply of housing units to offset the current shortage. According to Healey-Driscoll Administration reports, Massachusetts needs to add approximately 200,000 new homes to accommodate growth and achieve a healthy vacancy rate, as currently only 1.6% of housing units are available for sale or rent.
With such so much need, the question of “how?” quickly expands to “where?”.
Teaming with ULI Boston, Arrowstreet’s Research and Data Science Team worked to build a data visualization tool capable of identifying the Massachusetts communities best suited for expanding housing opportunities. Our research began with identifying three critical components necessary for a community to successfully incentivize and develop new housing:
- Mobility: High-quality transit infrastructure, with multiple modes of transportation already in-place and ready to support new housing.
- Opportunity: Local zoning regulations and permitting processes that are supportive of multifamily housing and increased density.
- Demand: A strong existing housing market and desirable community amenities that make the area an attractive place to live, and financially viable for new developments.
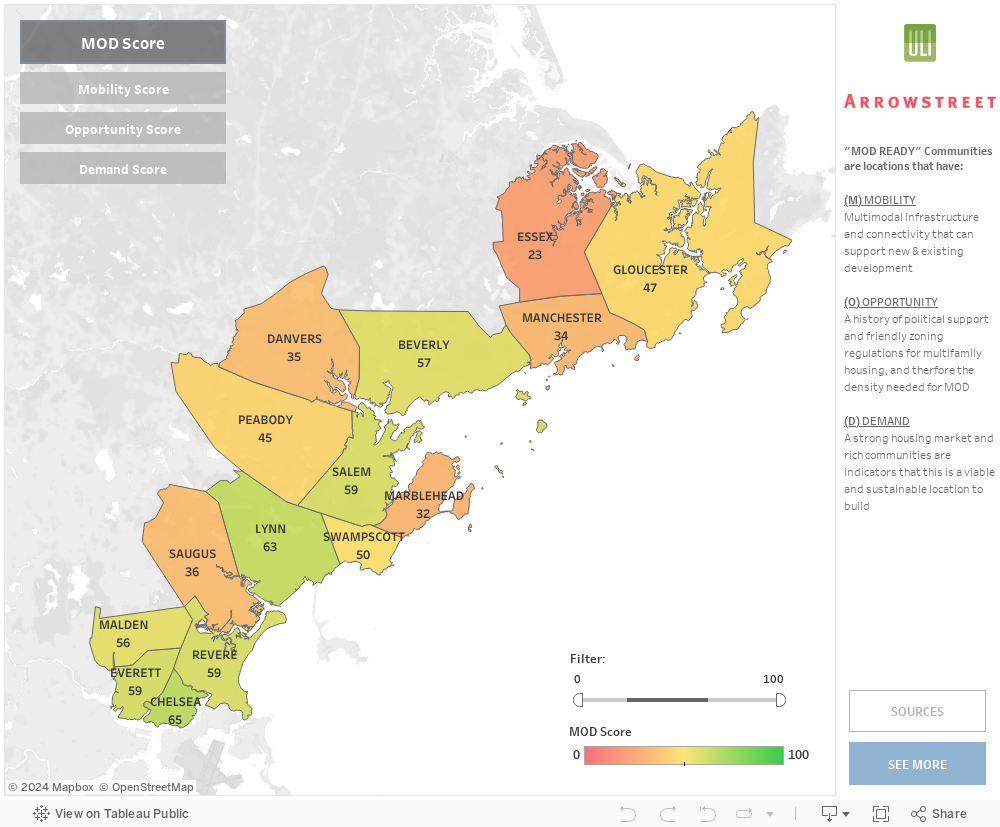
Using this framework, ULI Boston & Arrowstreet studied 15 communities along the North Shore as a part of a pilot program. Arrowstreet identified and collected over 60 data points measuring aspects of Mobility, Opportunity & Demand, including a community’s AllTransit & Connectivity Scores, Vacancy Rates, Forms of Government, Job Access Scores, Tax Rates, and School District Ratings among many others. Building on our experience as data scientists, urban planners, and architects, we synthesized this data into one comprehensive Mobility, Opportunity & Demand rating, or “MOD Score” for short. Each community’s score provides a data driven glimpse into that town’s readiness for adding new mobility-oriented housing relative to its peers.
As a means for helping communities understand their MOD Score, we built an interactive tool where stakeholders, elected officials, residential developers, and community members can visualize their town’s score and filter the results based on specific priorities. For example, if the user wants to understand which communities rank highest in mobility infrastructure, a slider is provided to add more weight to that component, highlighting the communities who perform best in that category. Access to the tool is provided to everyone as a means of fostering educated discussions around expanded housing opportunities and aiding key decision making to help support sustainable and equitable housing growth in each community.
Project Details
Location
Massachusetts